K-Means Clustering for Unsupervised Machine Learning

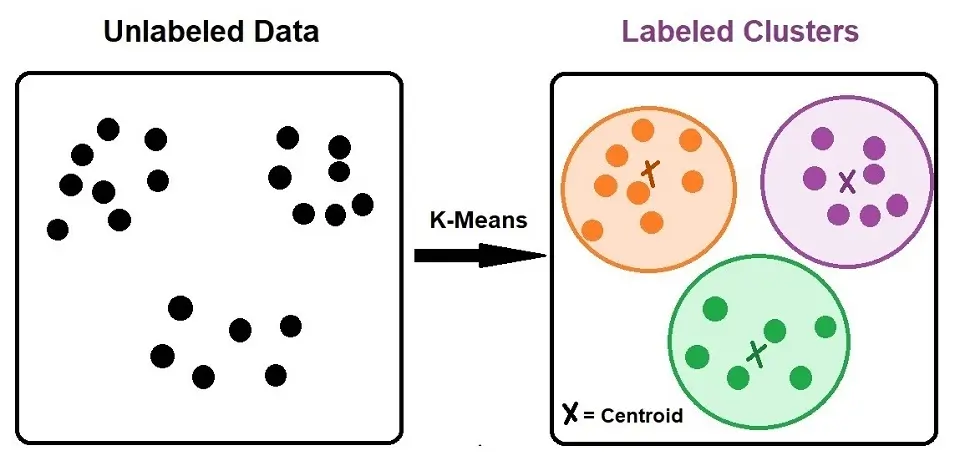
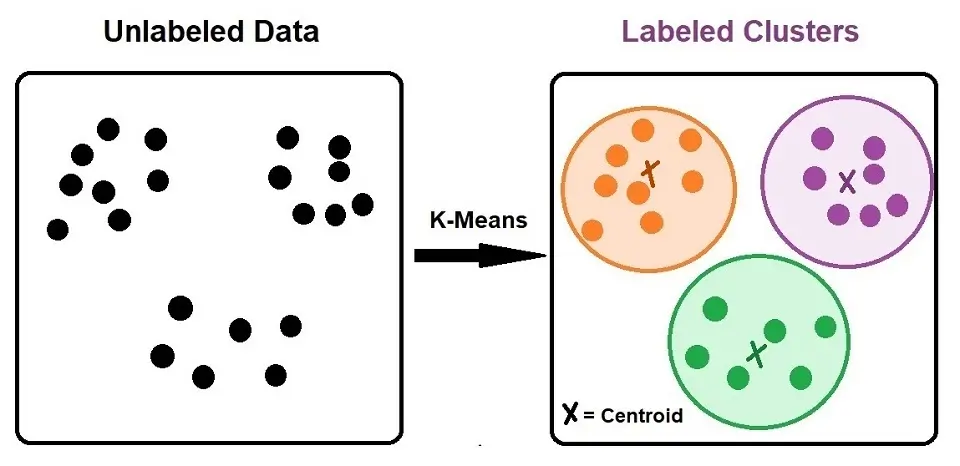
K-means clustering is a type of unsupervised learning when we have unlabeled data (i.e., data without defined categories or groups). Clustering refers to a collection of data points based on specific similarities.
K-Means Algorithm
K-means aims to find groups in the data, with the number of groups represented by the variable K. Based on the provided features, the algorithm works iteratively to assign each data point to one of the “K” groups. Please note that the clustering of the data points is by the similarity of features.
K-Means uses of Centroid Model algorithm. Centroid Models use the notion of data points that are close to the center of clusters having a relation.
A target number referred to as ‘k’ is the number of centroids you need in the dataset. A centroid is the cluster’s center, and each data point is assigned to a specific cluster.
The ‘means’ in the name refers to the averaging of the data, which helps to find the centroid location.
The K-means algorithm aims to reduce the distance between the data points and their cluster centroid.
What is a Centroid?
Centroid is a method of clustering that represents each cluster by a single mean vector, known as the centroid. The centroid is the average of all points belonging to the cluster. The K-means algorithm assigns data points to the cluster whose centroid is nearest to the point. Throughout the algorithm’s iterative process, these centroids are recalculated as the mean value of all points assigned to the cluster. Thereby refining the cluster assignment with each iteration until the process converges or meets a defined stopping criterion.
How Does the K-Means Algorithm Work?
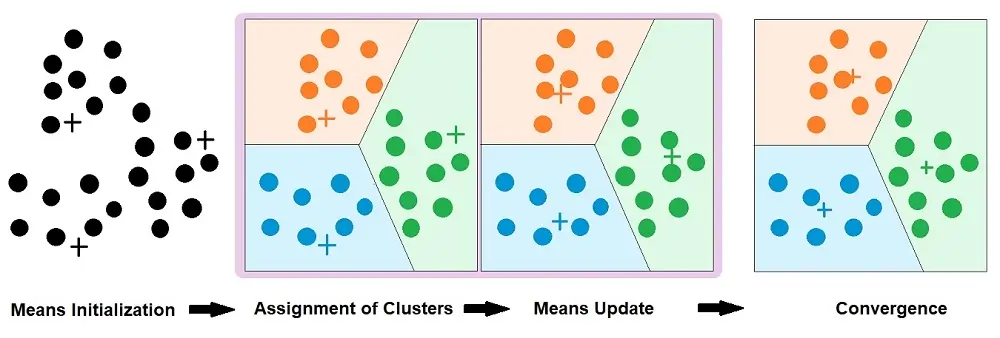
K-means clustering works in the following steps:
- Choosing the number of clusters (k): This is often done using methods like the elbow or silhouette method. This helps determine the optimal number of clusters by evaluating the within-cluster sum of squares (WCSS) or silhouette score.
- Randomly selecting initial centroids: While centroids can be randomly selected, some implementations of K-means use more sophisticated methods for initialization, such as the k-means++ algorithm, which aims to spread out the initial centroids before proceeding with the standard K-means optimization iterations.
- Assigning data points to the nearest centroid: The algorithm assigns each data point to the cluster with the closest centroid, typically using the Euclidean distance metric.
- Optimizing centroids: After the assignment, the centroids are recalculated as the mean of all points in their cluster, which may or may not result in the centroid moving.
- Iterative process: The assignment and update steps (3 and 4) are repeated until a stopping criterion is met. This could be a fixed number of iterations, a threshold of minimal changes in centroid positions, minimal changes in the assignment of the data points to the clusters, or when there is no further decrease in WCSS.
Please note that the quality of the cluster assignments is determined by the within-cluster sum of squares (WCSS), which the algorithm tries to minimize.
One of the challenges in K-means is choosing the right K, i.e., the number of clusters. This is often done using methods like the elbow method. In the elbow method, the WCSS is plotted against the number of clusters, and the “elbow point” of the curve is chosen as the optimal K.
Stop point for K-Means clustering:
Common stopping criteria for K-means include:
- No change in the centroids (i.e., the positions of the centroids do not change between iterations)
- No change in cluster assignments (i.e., data points remain in the same cluster)
- A predetermined number of iterations is reached
- The decrease in the within-cluster sum of squares (WCSS) between iterations is below a certain threshold.
When Can We Manually Stop the Process?
- If the centroids of newly formed clusters are not changing, we can interpret that the algorithm is not learning any new characteristics or patterns; acting as a sign to stop the training.
- If we have trained the algorithm for multiple iterations, however, the data points remain the same.
Choosing the Correct Number of Clusters, k.
Regarding my simple example above, I chose 2 clusters purely for the article. However, you might be wondering how to choose the right number of clusters.
There are two methods that you can use to select the correct value of k:
- Elbow Method
- Silhouette Method
Elbow Method
The Elbow Method is a popular tool that applies k-means for a range of values of k, and we plot it against the Sum of Squared Error, referred to as a scree plot.
The image below shows that the total Sum of Squared Error decreases as we increase the number of Clusters. The Elbow is a point from where there is no significant reduction in the Sum of the Squared Errors, even if the number of clusters increases further.

Source: TowardsDataScience
Using the Yellow Brick Library, you can use the following Python code to calculate the Elbow method:
from yellowbrick.cluster import KElbowVisualizerThe above Python statement imports the “KElbowVisualizer” class from the “yellowbrick.cluster” module.
Yellowbrick is a machine learning visualization library in Python that extends the scikit-learn API with visual analysis and diagnostic tools.
The “KElbowVisualizer” implements the “elbow” method of selecting the optimal number of clusters for K-means clustering by fitting the model with a range of values for “K“. It then visualizes the average within-cluster distances to help you select the value of “K” where the improvement to the average distance falls off, i.e., the “elbow” of the curve.
Silhouette Method
The Silhouette method is different from the Elbow method. It calculates the Silhouette coefficient of every point. A Silhouette Coefficient, or the Silhouette Score, is a metric to calculate the efficiency of a clustering technique, ranging from the values -1 to 1.
The computation of the Silhouette Coefficient takes place for each data point by first determining the average distance from the point to the other points in its cluster, denoted as ‘a’. It then measures the average distance from the point to the points in the nearest cluster that it is not a part of, denoted as ‘b’. The Silhouette Coefficient is calculated using these average distances.
The formula for the Silhouette method:
Using Scikit-Learn library, you can use this to calculate the Silhouette method:
from sklearn.metrics import silhouette_scoreSimple K-means Clustering algorithm example
In this example, we will implement a K-means Clustering algorithm using Python and Scikit-learn library to visualize a simple K-means clustering.
1. Import Libraries
# for reading and writing
import pandas as pd

# for efficient computations
import numpy as np

# data visualisation
import matplotlib.pyplot as plt

# Scikit-learn library
from sklearn.cluster import KMeans

%matplotlib inline
2. Generate Random Data
I have selected 150 data points to divide into two groups.
# Using np.random.rand to generate the random data
X= -2 * np.random.rand(150,2)
X1 = 1 + 2 * np.random.rand(50,2)
X[50:100, :] = X1

# Plot the randomly generate data on a simple graph
plt.scatter(X[ : , 0], X[ :, 1], s = 50)
plt.show()
3. Scikit-Learn
I will use the tools available in the Scikit-Learn library to process the randomly generated data into clusters. This is where I am selecting my number of clusters. For this example, I will be using two clusters:
# we also imported this library above
from sklearn.cluster import KMeans

# number of clusters, k = 2
Kmean = KMeans(n_clusters=2)

# Scikit-Learn KMeans tool which fits the data points to a meanKmean.fit(X)
4. Finding the Centroids
After selecting the number of clusters, ‘k’. Our next step was to find the Centroid. In order to do this, we run this code:
# this will find the center of the clusters (the Centroid)
Kmean.cluster_centers_
The output:
array([[ 2.05811397,  2.10446134],
       [-0.89414529, -1.0509698 ]])
5. Applying the Centroids
You can see the assignment of two centroids, one is Green, and the other is Orange.
plt.scatter(X[ : , 0], X[ : , 1], s =50)
plt.scatter(2.05811397, 2.10446134, s=200)
plt.scatter(-0.89414529, -1.0509698, s=200)
plt.show()
If you would like to test the algorithm or see which data points have been assigned to which characteristic, you can do so by the following code:
Kmean.labels_Output:
array([1, 1, 1, 1, 1, 1, 1, 1, 1, 1, 1, 1, 1, 1, 1, 1, 1, 1, 1, 1, 1, 1,
       1, 1, 1, 1, 1, 1, 1, 1, 1, 1, 1, 1, 1, 1, 1, 1, 1, 1, 1, 1, 1, 1,
       1, 1, 1, 1, 1, 1, 0, 0, 0, 0, 0, 0, 0, 0, 0, 0, 0, 0, 0, 0, 0, 0,
       0, 0, 0, 0, 0, 0, 0, 0, 0, 0, 0, 0, 0, 0, 0, 0, 0, 0, 0, 0, 0, 0,
       0, 0, 0, 0, 0, 0, 0, 0, 0, 0, 0, 0, 1, 1, 1, 1, 1, 1, 1, 1, 1, 1,
       1, 1, 1, 1, 1, 1, 1, 1, 1, 1, 1, 1, 1, 1, 1, 1, 1, 1, 1, 1, 1, 1,
       1, 1, 1, 1, 1, 1, 1, 1, 1, 1, 1, 1, 1, 1, 1, 1, 1, 1], dtype=int32)
6. Testing
If you wish to test your K-means cluster, generate a sample, reshape it, and use “Kmeans.predict”. This will assign the new data point to a centroid. Please check the following code:
sample_test=np.array([-2.0,-2.0])
second_test=sample_test.reshape(1, -1)
Kmean.predict(second_test)
Output:
array([1], dtype=int32)Advantages and Disadvantages of K-means
Advantages:
- Simplicity and Speed: K-means is easy to understand and implement. It is computationally efficient, making it suitable for large datasets.
- Scalability: The algorithm can easily handle very large datasets, especially when using variations like Mini-Batch K-Means.
- Adaptability: It can be adapted with various distance metrics (though the standard is Euclidean distance).
- Well-studied: As one of the most used clustering algorithms, there are many resources and community knowledge for troubleshooting and improving its performance.
- Feature Space Reduction: It can reduce the feature space to help with data visualization (e.g., identifying the centroids can simplify the complexity of the data).
Disadvantages:
- Choosing k: Determining the number of clusters (k) is not straightforward and often requires domain knowledge or additional methods like the elbow method or silhouette analysis.
- Sensitivity to Initial Centroids: The final results can be sensitive to the initial random assignment of centroids, leading to different clustering results from run to run.
- Sensitivity to Outliers: K-means clustering is sensitive to outliers, as a single outlier can significantly shift the centroid of a cluster.
- Assumption of Spherical Clusters: It assumes that clusters are spherical and evenly sized, which might not always be true. Consequently, it does not work well with complex geometric shapes (e.g., elongated clusters or manifolds).
- Difficulty with Different Densities: K-means clustering struggles when clusters have varying densities and different numbers of points.
- Hard Clustering: It assigns each data point to a single cluster (hard clustering), rather than providing probabilities of belonging to various clusters (soft clustering).
- Local Optima: K-means may converge to a local optimum, which is not necessarily the best solution. Repeated runs with different initializations are often necessary to get a satisfactory result.
- In practice, these disadvantages mean that while K-means is a good starting point for clustering analysis, it may not be suitable for all datasets or problems, and we may require other clustering algorithms for more nuanced analysis.
Applications of K-Means Clustering
K-means clustering is a versatile algorithm with a wide array of applications across various fields. Here are some detailed examples of its applications:
Market Segmentation:
Companies use K-means to partition customers into groups based on similar attributes like buying habits, demographics, and psychographics. This allows for targeted marketing strategies, personalized customer engagement, and efficient allocation of marketing resources.
Document Clustering:
In text mining, K-means can be used to group similar documents, which helps organize large volumes of text data. This grouping improves information retrieval systems. Moreover, it helps in the identification of thematic patterns across documents.
Image Segmentation:
K-means is used in computer vision to segment digital images into distinct regions. This is useful for object recognition, image compression, and enhancing the effectiveness of other image processing tasks.
Anomaly Detection:
By clustering data into groups, K-means can help identify data points that do not belong to any cluster or are significantly far from their centroids, which could be potential anomalies or outliers.
Feature Learning:
It can be used for feature engineering by identifying prominent clusters within feature sets, which can then be used to create new features that help improve the performance of predictive models.
Pattern Recognition:
K-means is employed to find patterns and associations in datasets, such as identifying the behavior of complex systems or common sequences in DNA strings.
Astronomy:
In astronomy, K-means helps in clustering and classifying galaxies based on their shapes and other properties, aiding in the study of cosmic evolution and the universe’s structure.
Insurance Fraud Detection:
Insurers utilize clustering to find patterns and groupings in claims data that may indicate fraudulent activity, enabling them to focus investigative resources more effectively.
Healthcare:
In healthcare, K-means can cluster patient data to identify commonalities in medical conditions, leading to more personalized treatment plans and a better understanding of patient needs.
Operational Efficiency:
Manufacturing and service industries use K-means to improve operational efficiency by clustering machines with similar profiles or failures, streamlining maintenance and support processes.
Urban Planning:
K-means can be applied to cluster houses, roads, and areas to optimize the planning of utilities and services, like hospitals, schools, and emergency services.
Social Network Analysis:
Clustering users based on their connections and interactions can reveal communities within social networks, influential users, and the flow of information.
Conclusion
The above applications leverage K-means’ ability to make sense of unlabeled data by finding natural groupings within.
However, the success of K-means in these applications depends on the nature of the data and the careful selection of the number of clusters k. Other clustering techniques may be more appropriate in cases where the assumptions of K-means do not hold, such as non-spherical clusters or clusters of different sizes and densities.

Nisha Arya is a Data Scientist and Technical writer from London.
Having worked in the world of Data Science, she is particularly interested in providing Data Science career advice or tutorials and theory-based knowledge around Data Science. She is a keen learner seeking to broaden her tech knowledge and writing skills while helping guide others.


